Here's an interactive dashboard to guide you through the Lok Sabha election results 2019. Colour of the constituency/state changes as per results declared in realtime.
Region
North
North East
South
Central
East
West
Party
BJP
INC
AAP
Others
gender
Male
Female
Transgender
Assets
< 1 Crore
1 - 100 Crore
> 100 Crore
Criminal Cases
Yes
No
Educational Background
Literate
Illiterate
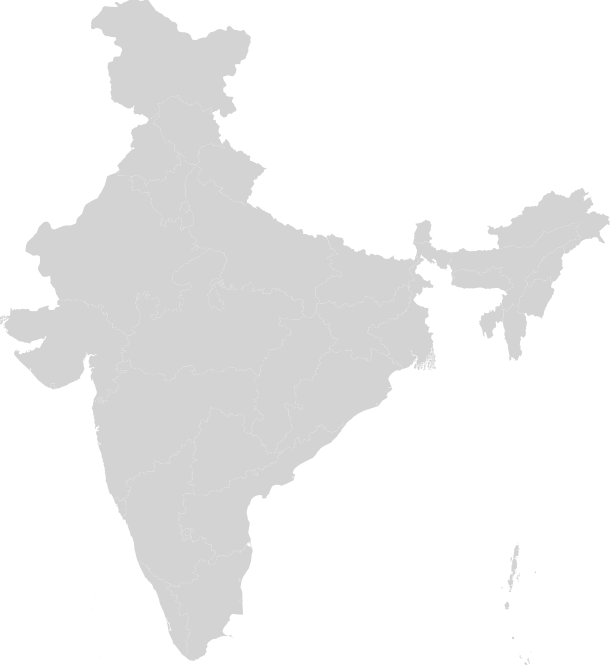
MAP
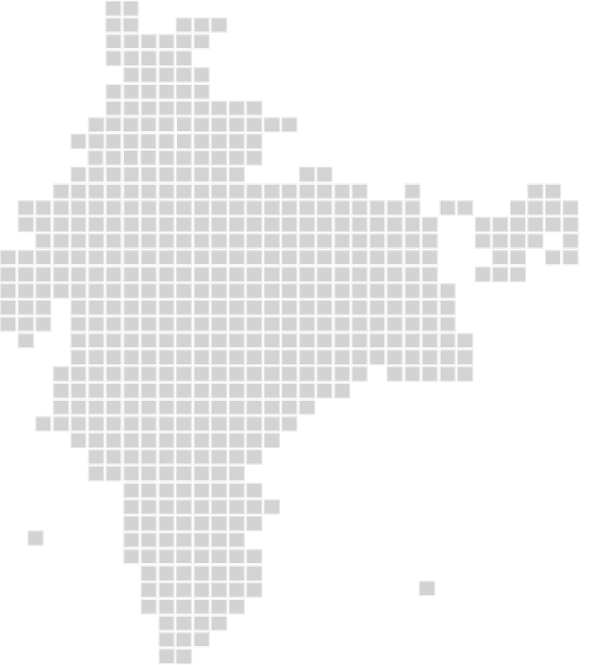
Cartogram
Seat Share Analysis
Here is the state cartogram of India. Each box represents a State or Union Teritory.
Party Wise
Seats won by each party in share of the parties in each state.
Alliance Wise
Seats won by each alliance each state.
Flip Analysis
The 543 squares represent every constituency and are grouped by the 2014 winners. BJP and INC got 282 and 44 seats respectively in 2014, therefore 282 and 44 squares are shown below each of them. Rest of the 216 squares are grouped under 'Others'.
The color of the squares represent the party which won that constituency in 2019.
INC
BJP
OTHERS